The advanced metrics that show why Partey is Arsenal’s unsung hero
Articles / /

Stats Perform's advanced metrics show how important Thomas Partey has been to Arsenal this season
Written by Jonny Whitmore — January 4, 2023
ANALYSIS is changing.
In the past, datasets were typically descriptive - explaining what was happening at a particular point - or they were diagnostic - assessing why something had happened.
Now there is a new way of looking at football data, which is prescriptive - recommending what a player should have done in a particular situation.
This is a new way of looking at analytics and it will impact performance analysis, recruitment and much more in the months and years to come. And as analysis changes, so too datasets will need to become more advanced than ever before.
At Stats Perform, we've been working on a new generation of deeper sports data with the introduction of new Opta Vision performance metrics, which comprise outputs trained on a combination of player event data and tracking data.
For this article I’m going to use some of these advanced metrics to compare three of the most accomplished deep-lying midfielders in the Premier League: Arsenal’s Thomas Partey, Chelsea’s Jorginho and Liverpool’s Fabinho.
While the three players do play slightly different roles for their teams, they have similar numbers in terms of minutes played, pass quantity and underlying metrics.
All of this is comparing event data in isolation, which is an easy way to get low-level context if producing an opposition scouting report, working on player recruitment, or perhaps if you’re working in broadcasting. These are simple and understandable outputs.

Jonny Whitmore will be speaking at TGG Live in Manchester on October 9th. To find out more about this two-day event and to buy tickets, click the button below
Partey, Jorginho and Fabinho have similar passing outputs this season (data up to the World Cup break). They all play about 65 passes per 90 minutes, although Fabinho and Partey are more likely to complete their passes (pass completion: Partey 87.5%, Jorginho 84.4% and Fabinho 88.2%) and they also go a bit longer (Partey plays a long pass 8.5% of the time, Jorginho 6.2% and Fabinho 8.9%).
In terms of direction of pass, Partey plays forward 30% of the time, Jorginho 31% and Fabinho 25.2%.
This is all fine, but what I want to do is add layers of context within each dataset. The more information and context we can provide to our coaching, recruitment and leadership teams, then the better we will be able to inform decision-making.
As a data specialist, you need not only to save your own time, but save other people’s as well. This is fundamental as a practitioner, as it’s really important to prove your value.
So now we can move onto tracking data, again in isolation, and this shows us that from a physical perspective, Partey shines a little more than the other two. He has a few more sprints (sprints per 90 minutes: Partey 6, Jorginho 4.5, Fabinho 5.4) and a higher top speed (Partey 32.9km/h, Jorginho 30km/h and Fabinho 30.3km/h), although his distance covered is a bit lower (distance covered per 90: Partey 10.4km, Jorginho 11.1km and Fabinho 10.9km).
This is fairly low-hanging fruit - but when we combine the event and tracking data we are able to look at new metrics: line-breaking passes, passes under pressure and the amount of pressure applied by the opposition to the three players. Now you get a different profile.
Partey averaged 4.1 line breaking passes per 90, compared to Jorginho with 2.2 and Fabinho with 3.2, The Arsenal man was also top for pass completion under pressure (Partey 90.2%, Jorginho 75% and Fabinho 86%), while the average number of high intensity pressures applied by the opposition to him per 90 was 6.9, compared to Jorginho with 9.3 and Fabinho with 8.2.
These datasets measure the choices that each player made. What I want to also look at is the choices that he DIDN’T make. How can we use some of these new models to quantify that?
As an example, I’m going to use a pass that Partey made in Arsenal’s Premier League match at Brentford on September 18th (which the Gunners won 3-0). The move starts with a Granit Xhaka yellow card, Brentford lose the ball just inside their own half, Partey intercepts and then he plays a first-time pass to Gabriel Jesus (see the video below).
It’s a very quick decision, but what we are going to do is look at whether it made sense.
We can break down each of his potential passes and what we thought of them in a numerical sense. What we want to know about is the 10 team-mates Partey could have passed to and quantify each of these options.
Then, later on, we will be able to aggregate this to season-level metrics to get different profiles of players, which is extremely valuable. We have 10 options Partey could have made (passes to his 10 team-mates) and we want to filter these down to the most typical passes and then narrow down the quantity of measures of each.
We want to look at three things in assessing these potential passes:
- How likely was it that the pass could be made?
- How difficult was the pass?
- How threatening would the pass have been?
To do this, we can use three different tracking-based models:
- Expected Receiver (xReceiver): The probability of a player being the recipient of a pass. How typical was it for Partey to pass to each of his viable passing options given the circumstances?
- Expected Pass Completion (xP): The probability of a pass being completed. If there are lots of player in the way, or if it is a longer pass into a congested area, then you are less likely to complete it, for example.
- Expected Threat (xThreat): The likelihood of a shot occurring within 10 seconds of the player receiving the pass.
We have these 10 options and we want to filter down to the most typical passes using the Expected Receiver (xReceiver) model.
By filtering out the players who were unlikely to receive the pass, we can look to quantify the options who would typically receive the ball from this pass. We find that there were four typical options in this situation, including the pass that was made to Jesus (#9) in a very advanced position.
So which of these passes was safest? Based on the Expected Pass Completion (xP) model, the most likely pass to be completed was to Gabriel Martinelli (#11). That had a 95% chance of completion (xP = 0.95). Despite other options being much closer, Martinelli was in the most space and neither he nor Partey were under any pressure at the time of pass.
Next, which was the most threatening (xThreat) pass? It was actually the one to Martinelli again. With an xThreat value of 0.26, the model implies that choosing this option would have resulted in a shot within the next 10 seconds 26% of the time.
Despite Jesus being the furthest team-mate up field, the model recognises the trajectories of the players and can see that Martinelli was moving towards the opposition goal while Jesus was moving away from it.

These values don’t necessarily mean it was the best pass, but we can look at a combination of the metrics to find out more. I have defined a ‘good passing opportunity’ as a threatening pass that was also likely to be completed (image above).
Using a simple rule-based approach, I filtered down to the typical passes in this situation and defined an easy pass as one that had more than an 80% chance completion, and a threatening pass as being one in the upper quartile (so the top 25%) of dangerous passes over the course of a Premier League season.
The three passes that met these criteria - to Martinelli, Jesus and Xhaka (#34) - were sensible, progressive and threatening; they were good passing opportunities. Despite not playing the most easy and threatening of the options, Partey still chose a good option.
In contrast, had he passed back to Gabriel (#6), you could argue this was a missed opportunity. The data has enabled us to quantify his decision.
Within the Opta Vision Framework there is also a more sophisticated way of looking at this: an index to balance out the likelihood, threat and difficulty of the pass and to normalise the metrics relative to their averages.
We can also look at the amount of time Partey had on the ball and whether he was likely to make a more threatening pass had he taken more time.
Aggregating the data over a longer period of time is extremely valuable, particularly in recruitment, as it enables us to look at how often a player misses a good passing opportunity, how often they play the most threatening pass and how often they make the safest one.
Applying the aggregated datasets to Partey, Jorginho and Fabinho over the course of the 2022/23 season, we can see that their decision-making is actually quite different (image below). Despite having a very high pass-completion rate, Partey takes the safest option available to him only half the time (50%, compared to Jorginho 60% and Fabinho 62%).

He also makes the most threatening options of the three players, despite having this high pass completion rate. We can also look at how often the players take good passing opportunities and how often they miss them.
On average, if Partey had good opportunities from 100 passes, he didn’t take them on 11 occasions, equating to only 11% of the time (compared to Jorginho with 14% and Fabinho with 7%).
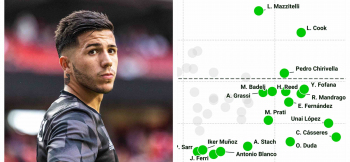
Another interesting aspect of this index is analysing the players when they were the options to receive the ball rather the passer (see image below). Now we can see that Partey is really available for Arsenal this season.

For about one in five passes by an Arsenal player when he is on the pitch (21%), Partey is an available option. Similarly, for passes starting in Arsenal’s own third, Partey is available for nearly one in four passes (23%).
A metric like this could help inform performance analysis to help target important players in the build-up or analyse other teams that have effectively reduced a player's availability this season.
And the most interesting metric of all that I created for the purposes of this presentation was this: when players are available, how often are they targeted? In other words, how often does a team-mate choose to pass to the player when they are available?
This shows us a trust aspect - ie which players are really relied upon to receive the ball?
Partey was targeted almost two thirds of the time by team-mates when he was available. The three most targeted players when available for Arsenal were Partey, Oleksandr Zinchenko and Jesus.
Central midfielders tend to feature prominently when ranking availability, because of their position on the pitch, but not always. For example, Liverpool’s most targeted player when available was Trent Alexander-Arnold (63% of the time), and for Wolves it was Adama Traore (63% of the time).
This is a different aspect of the game that hasn’t necessarily been quantified before. Whenever I watch Lionel Messi, I love the fact that even when he’s only slightly available, his team-mates always use him. The data backs this up, showing the Argentine legend was targeted 65% of the time in Ligue 1 up to the World Cup break.
Only two players were targeted more than him and they were centre backs, because typically possession-based teams will take their time in the build-up. The second-ranked forward was Sofiane Boufal of Angers, who was still about 7% below Messi.
These metrics can also give us an insight into player roles. If we look at how often a player was available to receive a pass starting in their team’s own third, we find that (perhaps unsurprisingly) Manchester City’s Erling Haaland was the second-least available player in the Premier League 2022/23 season, available for only 9.6% of these passes.
While you might expect forwards to be unavailable from these passes, at the other end of the scale, Kieffer Moore of Bournemouth was available for almost one in three passes that started in his own third, making him the third-most available player in the Premier League. The only players ranked higher than him were two Manchester City centre-backs.
Over the course of a Premier League season, if we look at 'typical passes’, a player has an average of almost two options when attempting to make a pass. I think this can be broken down for coaching principles of being available for team-mates and never providing just one passing option.
Players played the safest pass 62% of the time, and the most threatening pass 58% of the time.
We are not saying which option a player should have made - that is more down to the coaches and the players themselves - but we are providing tools and metrics that can help describe situations and aid decision makers.
These Opta Vision advanced models will be available for more than 50 competitions next season and will help people get a whole new context to the game.
- Jonny Whitmore heads up the Data Analyst team at Stats Perform. This article is taken from a presentation he gave at TGG's Big Data 2022 Webinar in December 2022, titled, 'How to quantify player decision-making with predictive data.'


-1.png)


